As noted in the previous post, many educational climate maps that rank high in internet image searches are based on a simplistic climatic model that is too focused on latitude. In this post, I scrutinize and criticize four such maps.
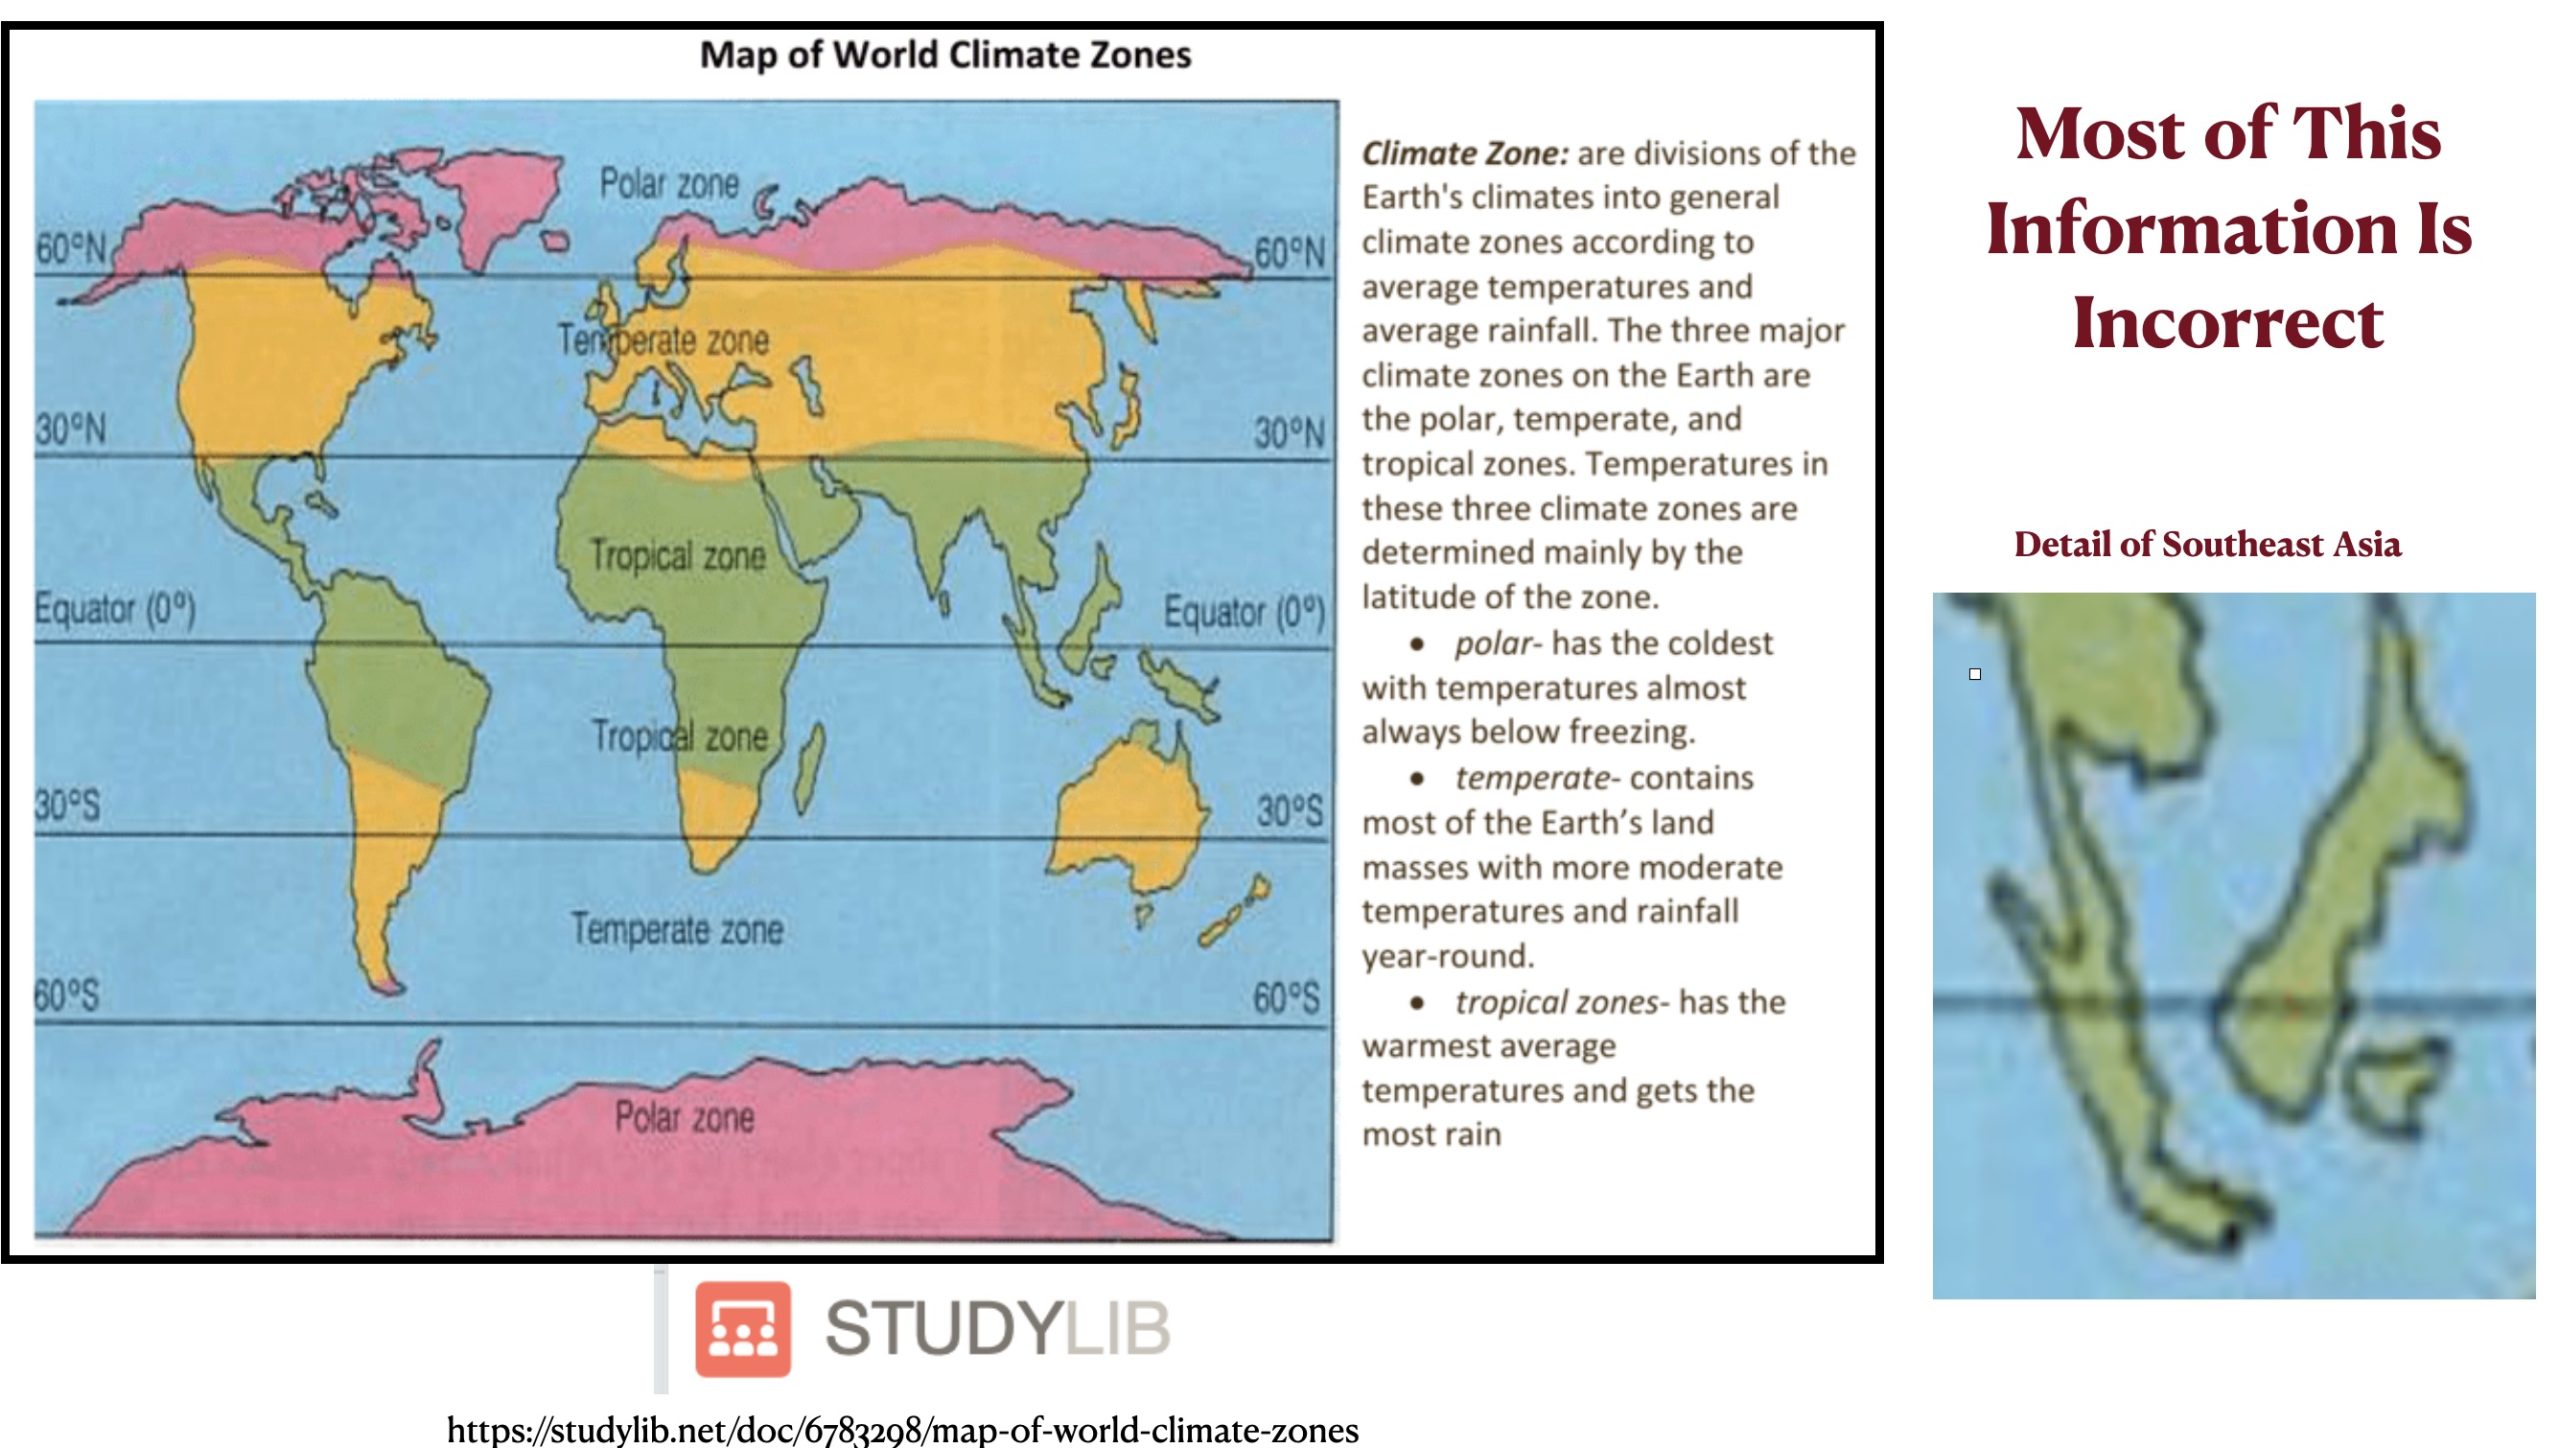
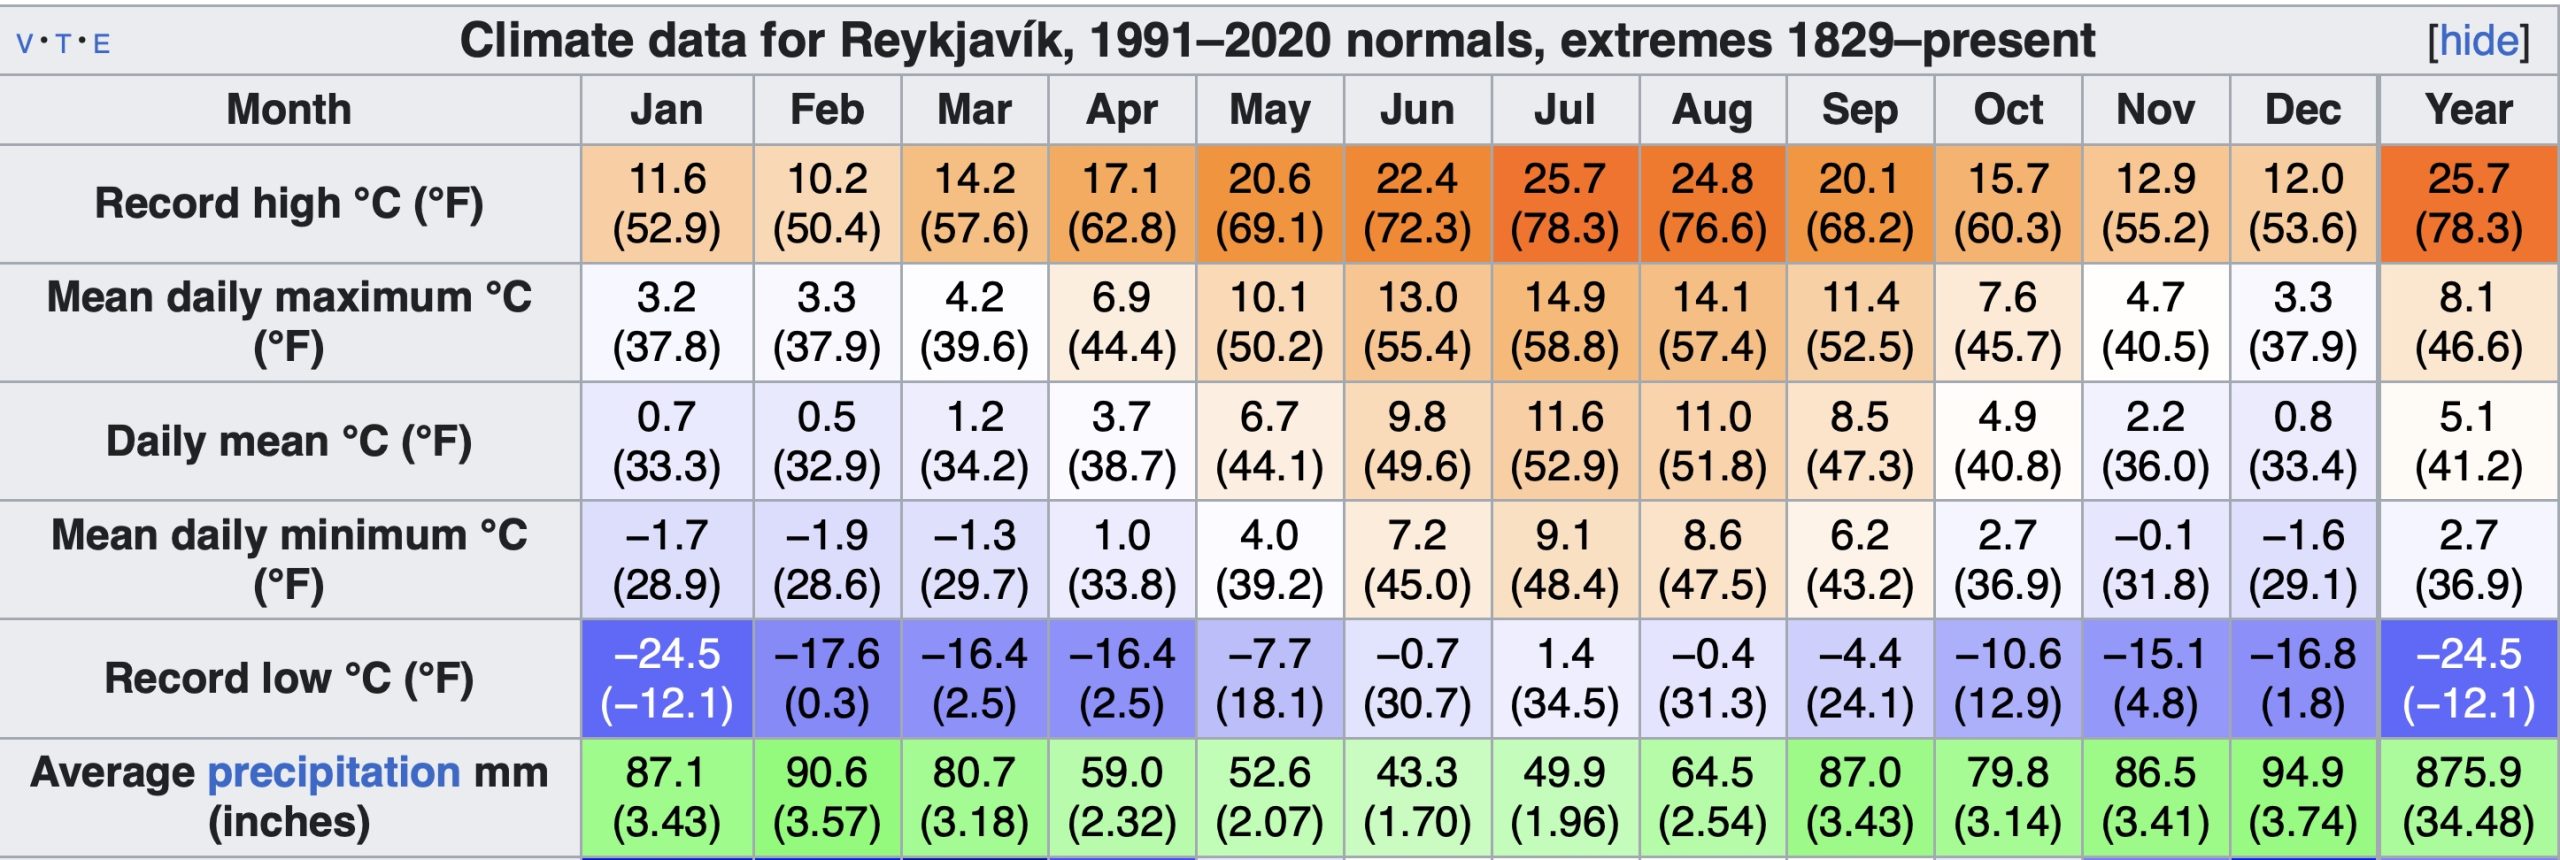
The most simplistic example that I found (posted below) essentially replicates Aristotle’s five-zone climate scheme, although it does not strictly follow latitudinal lines. The marginal notes on this STUDYLIB map claim that the climate zones that it depicts are based on both average temperature and average rainfall, but that is simply not the case. While the text states that the tropical zones “get the most rainfall,” the map puts the world’s largest hyper-arid area, the Sahara Desert, in this category. While the text states that the temperate zones experience “rainfall year-round,” the map puts many place that almost never get summer precipitation in this category. While the text states that the polar zones are “almost always below freezing,” the map puts relatively mild Iceland and the Alaska Peninsula along with the nearby Aleutian islands [1] in this category. Perhaps surprisingly, neither Reykjavík in Iceland nor Dutch Harbor in Alaska have a single month with a daily mean temperature below freezing. (The figure for the coldest month in Reykjavík [February] is 32.9°F/0.5° C, and for Dutch Harbor is 33.0°F/0.6° C.) Note also that the base map is extraordinarily crude, especially in its depiction of Southeast Asia.
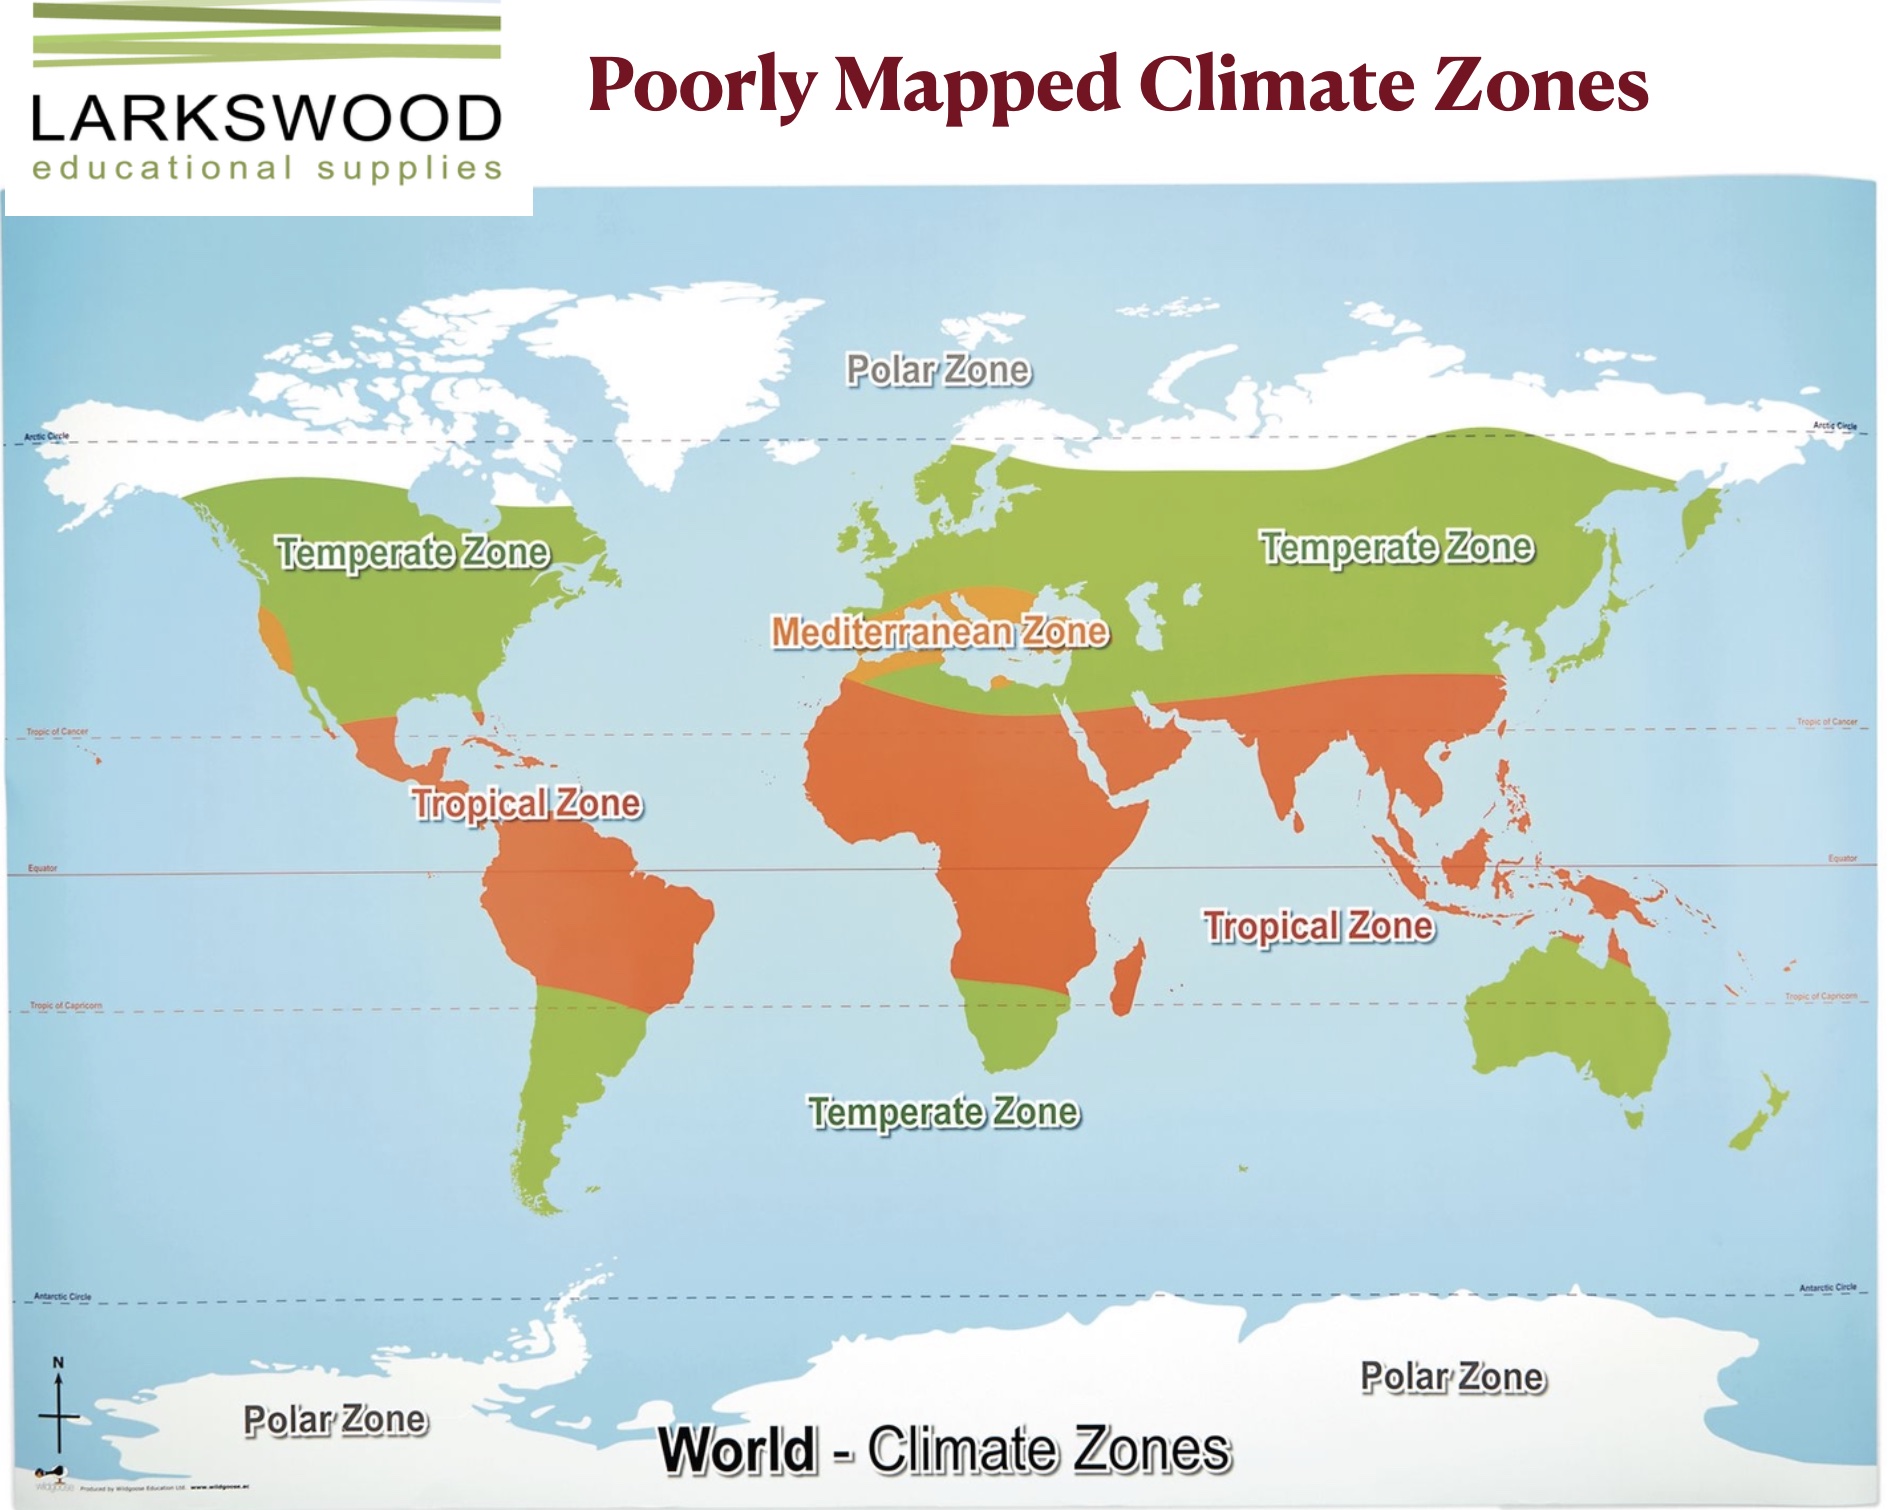
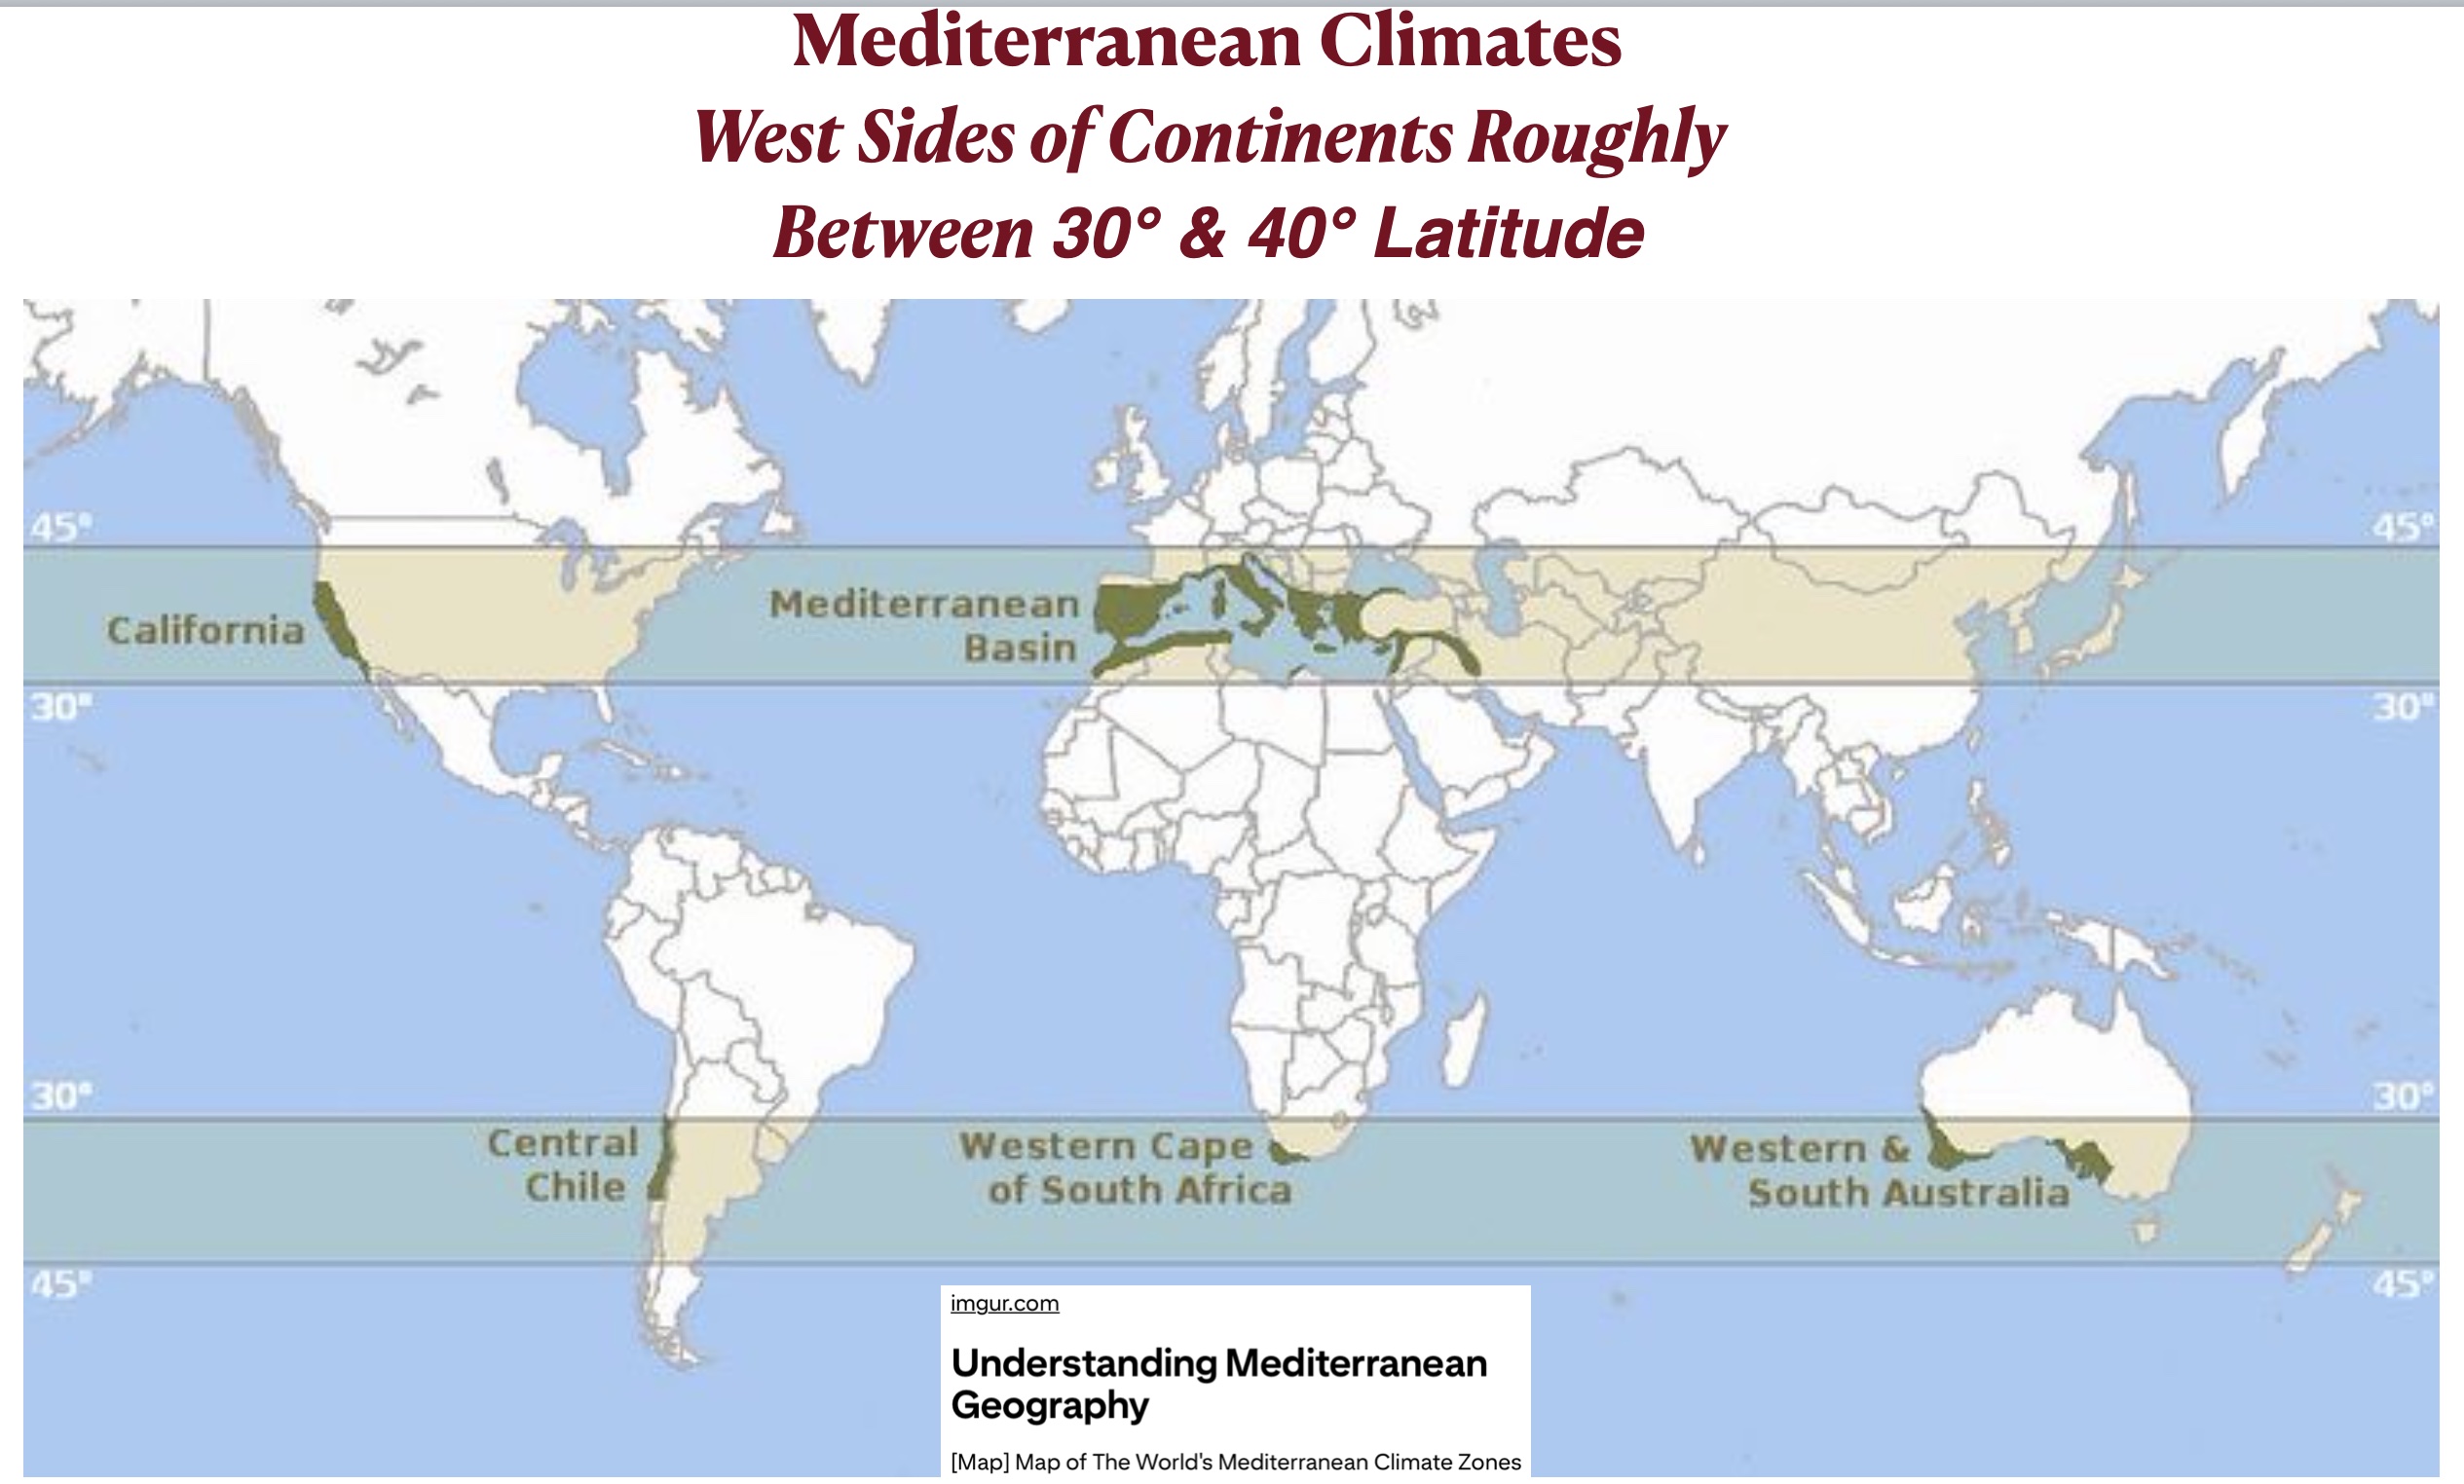
The second map, produced by Larkswood Educational Supplies, is essentially the same as the first, although it adds two “Mediterranean” zones, one in California and the other in the Mediterranean itself. The addition of this dry-summer zone is an improvement, but the map fails to get the geography right. It is oddly missing the eastern Mediterranean and it ignores the Mediterranean-climate zones in central Chile, southwestern South Africa, and southwestern and south-central Australia. It also puts areas with non-Mediterranean climates, such the Po Valley of Italy and most of the Danube Basin, in the Mediterranean category.
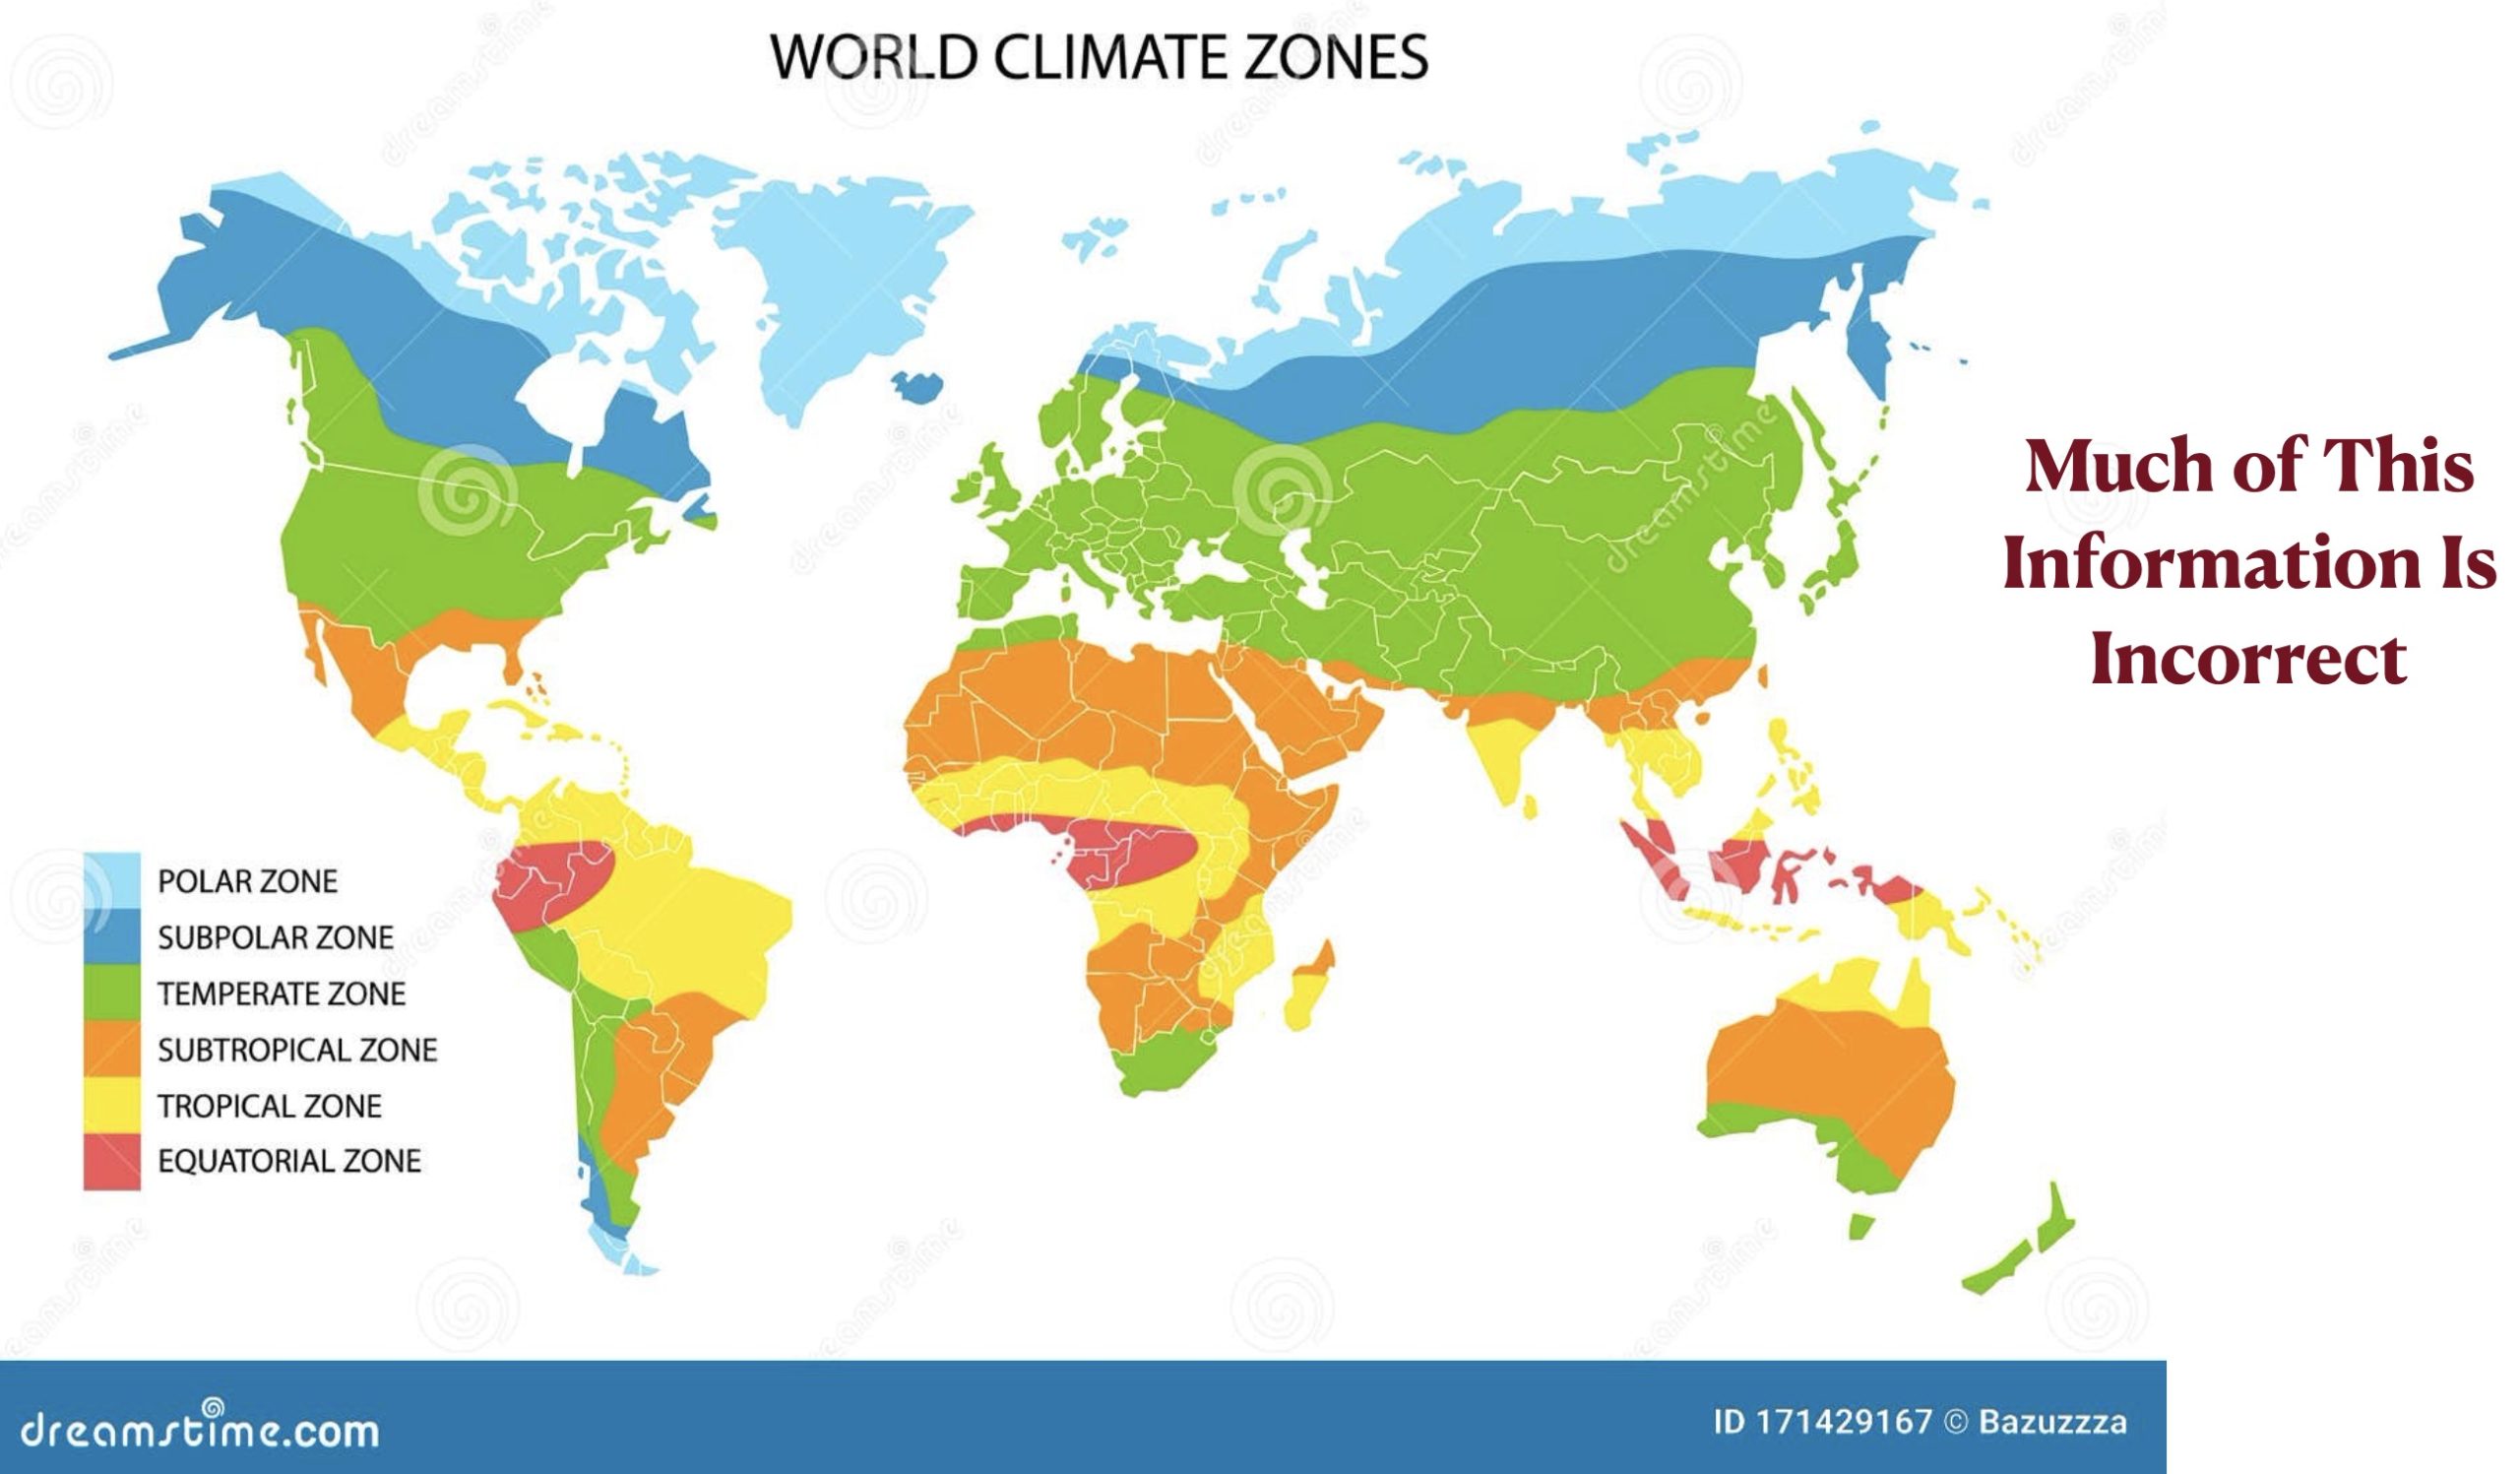
The third map, produced by Dreamstime.com, has six climate zones. As such, it is an improvement over the first two, although, unlike the second, it fails to differentiate Mediterranean climates. Its miscues, however, are many. It places hyper-arid northwestern Peru [2], for example, in the equatorial zone, which is generally characterized by heavy rainfall over most of the year, yet it excludes most of hyper-wet western Colombia from the same category. It puts Irkutsk, Russia, with a mean January low temperature of -6.5°F/-21.4°C, in the temperate zone, yet it does the same with tropical Dhaka, Bangladesh [3], which a record low temperature of 42.1°F/5.6°C and an annual daily mean temperature of 78.8°F/26.0°C. The much colder city Shreveport, Louisiana, with a record low of -5.0°F/-21°C and an annual daily mean temperature of 66.6°F/19.2°C, is conversely placed in the subtropical zone. Such mapping makes no sense.
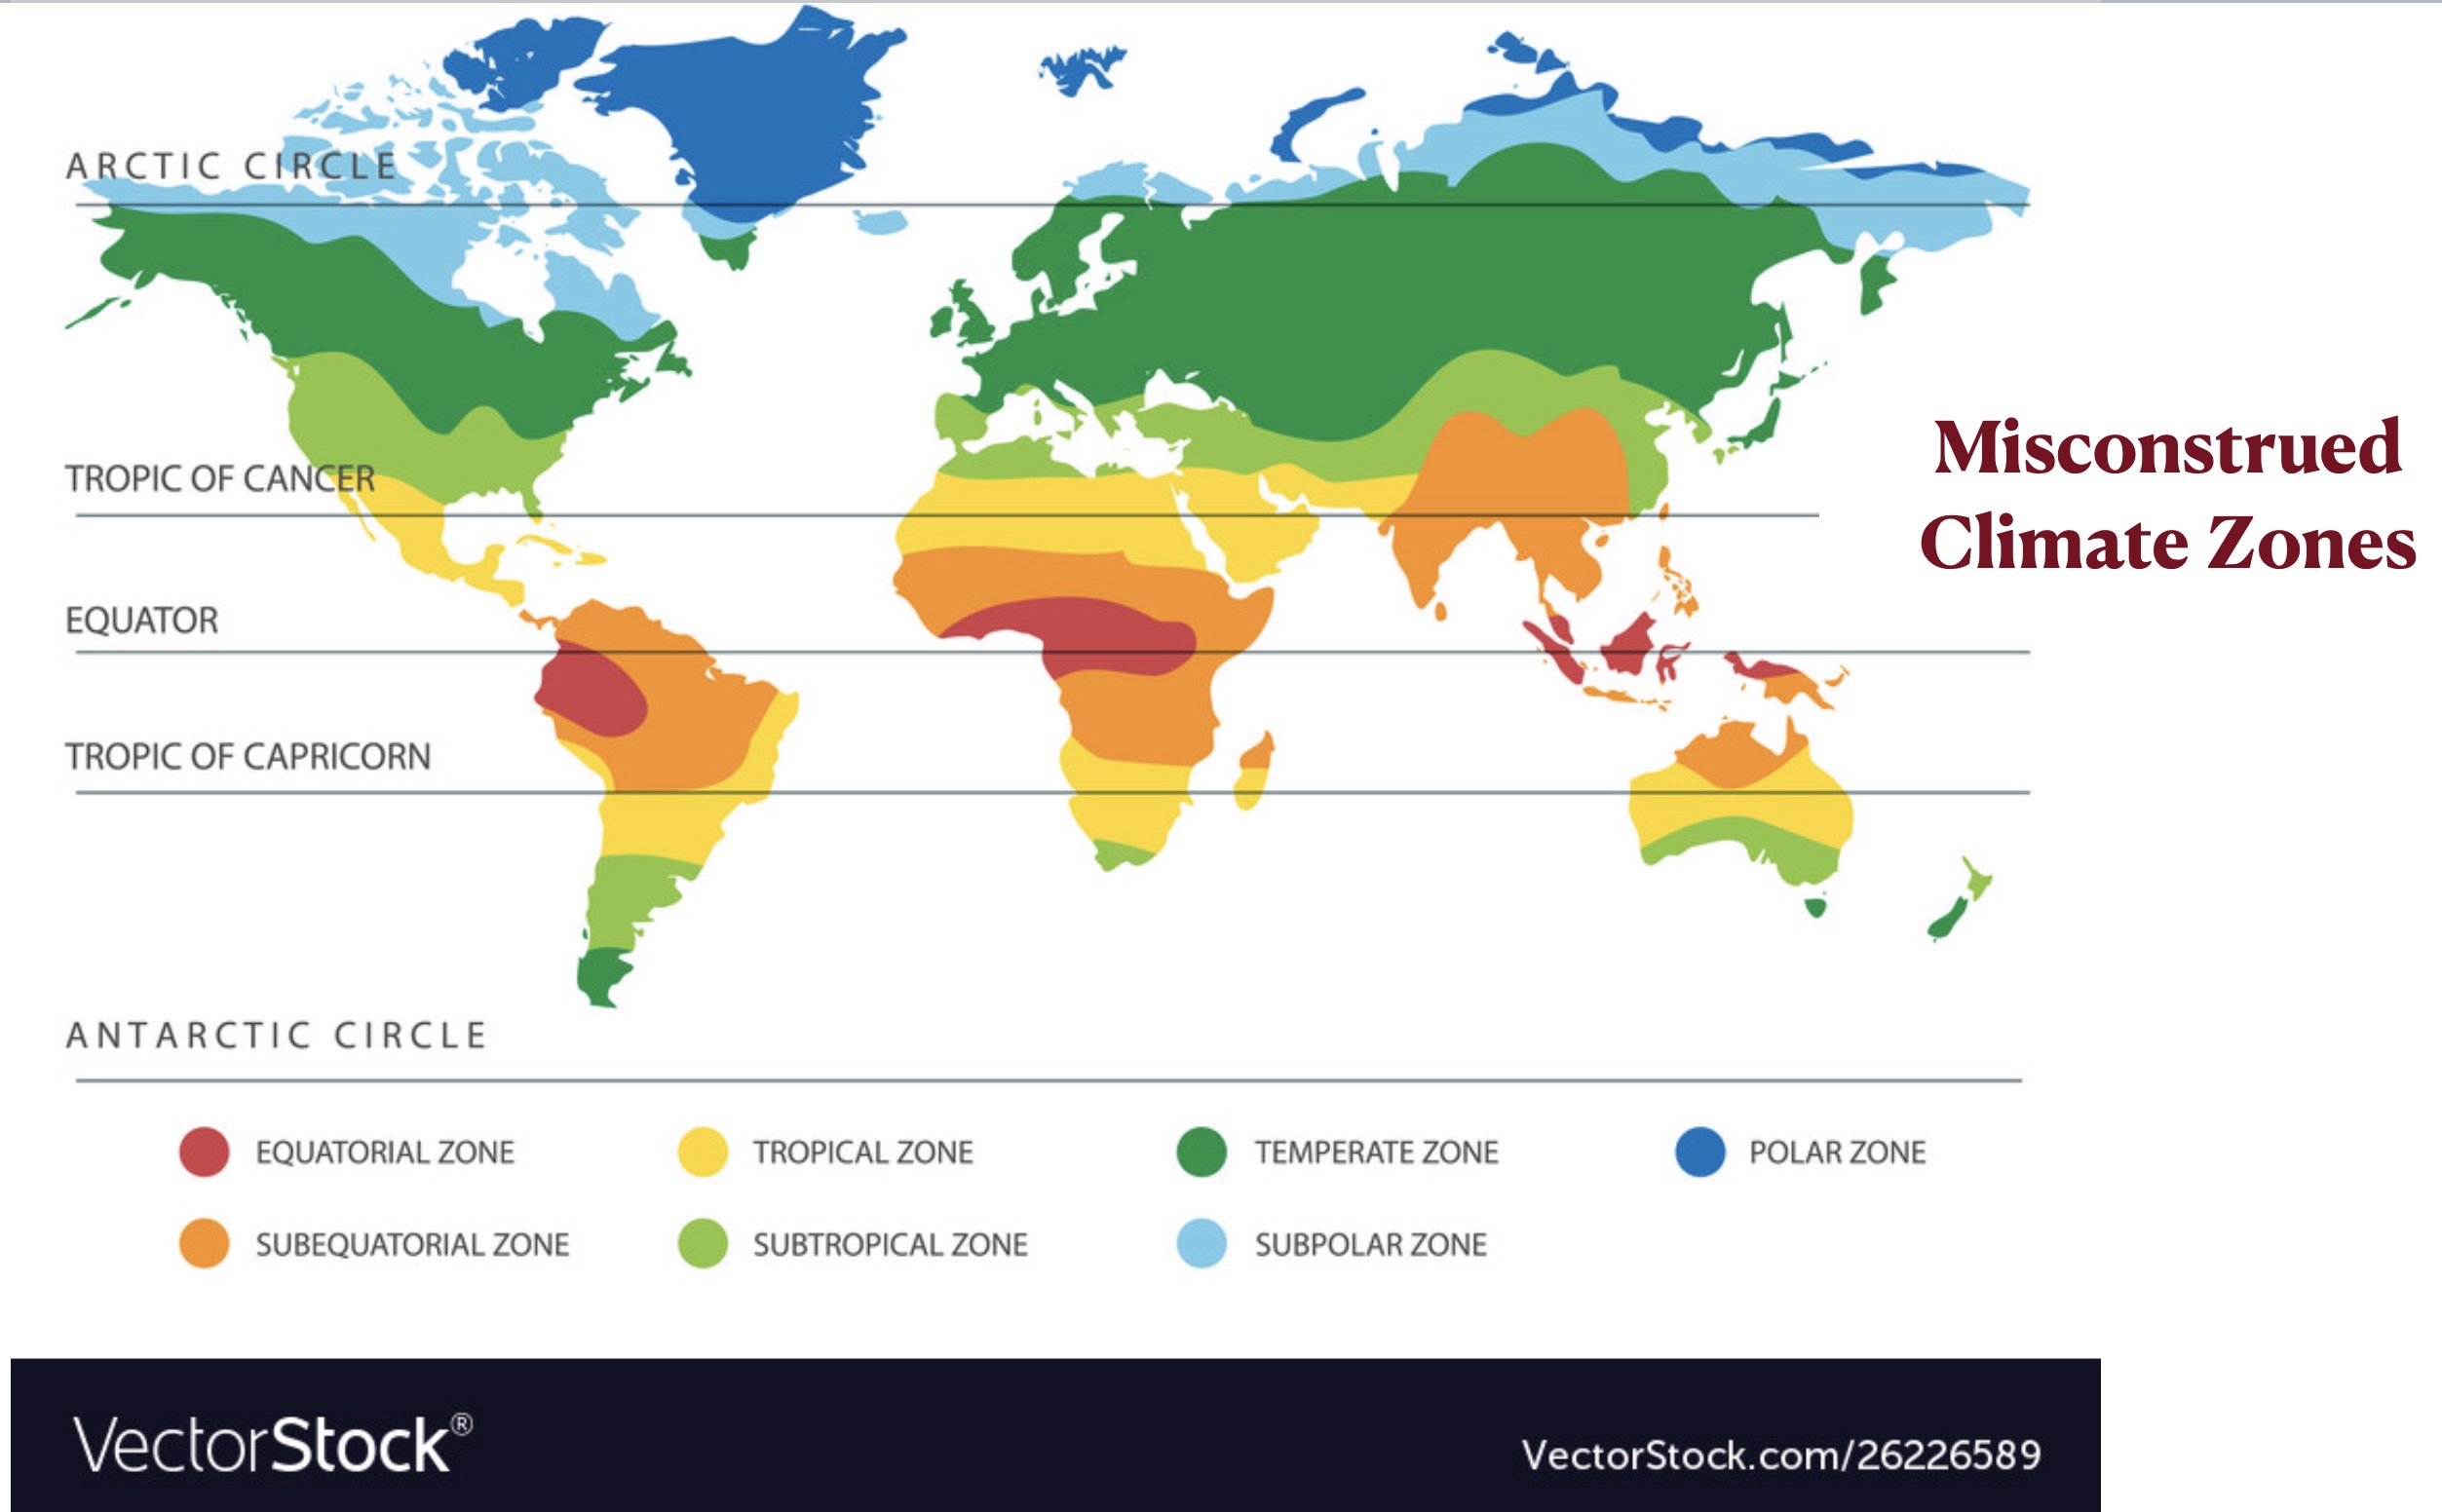
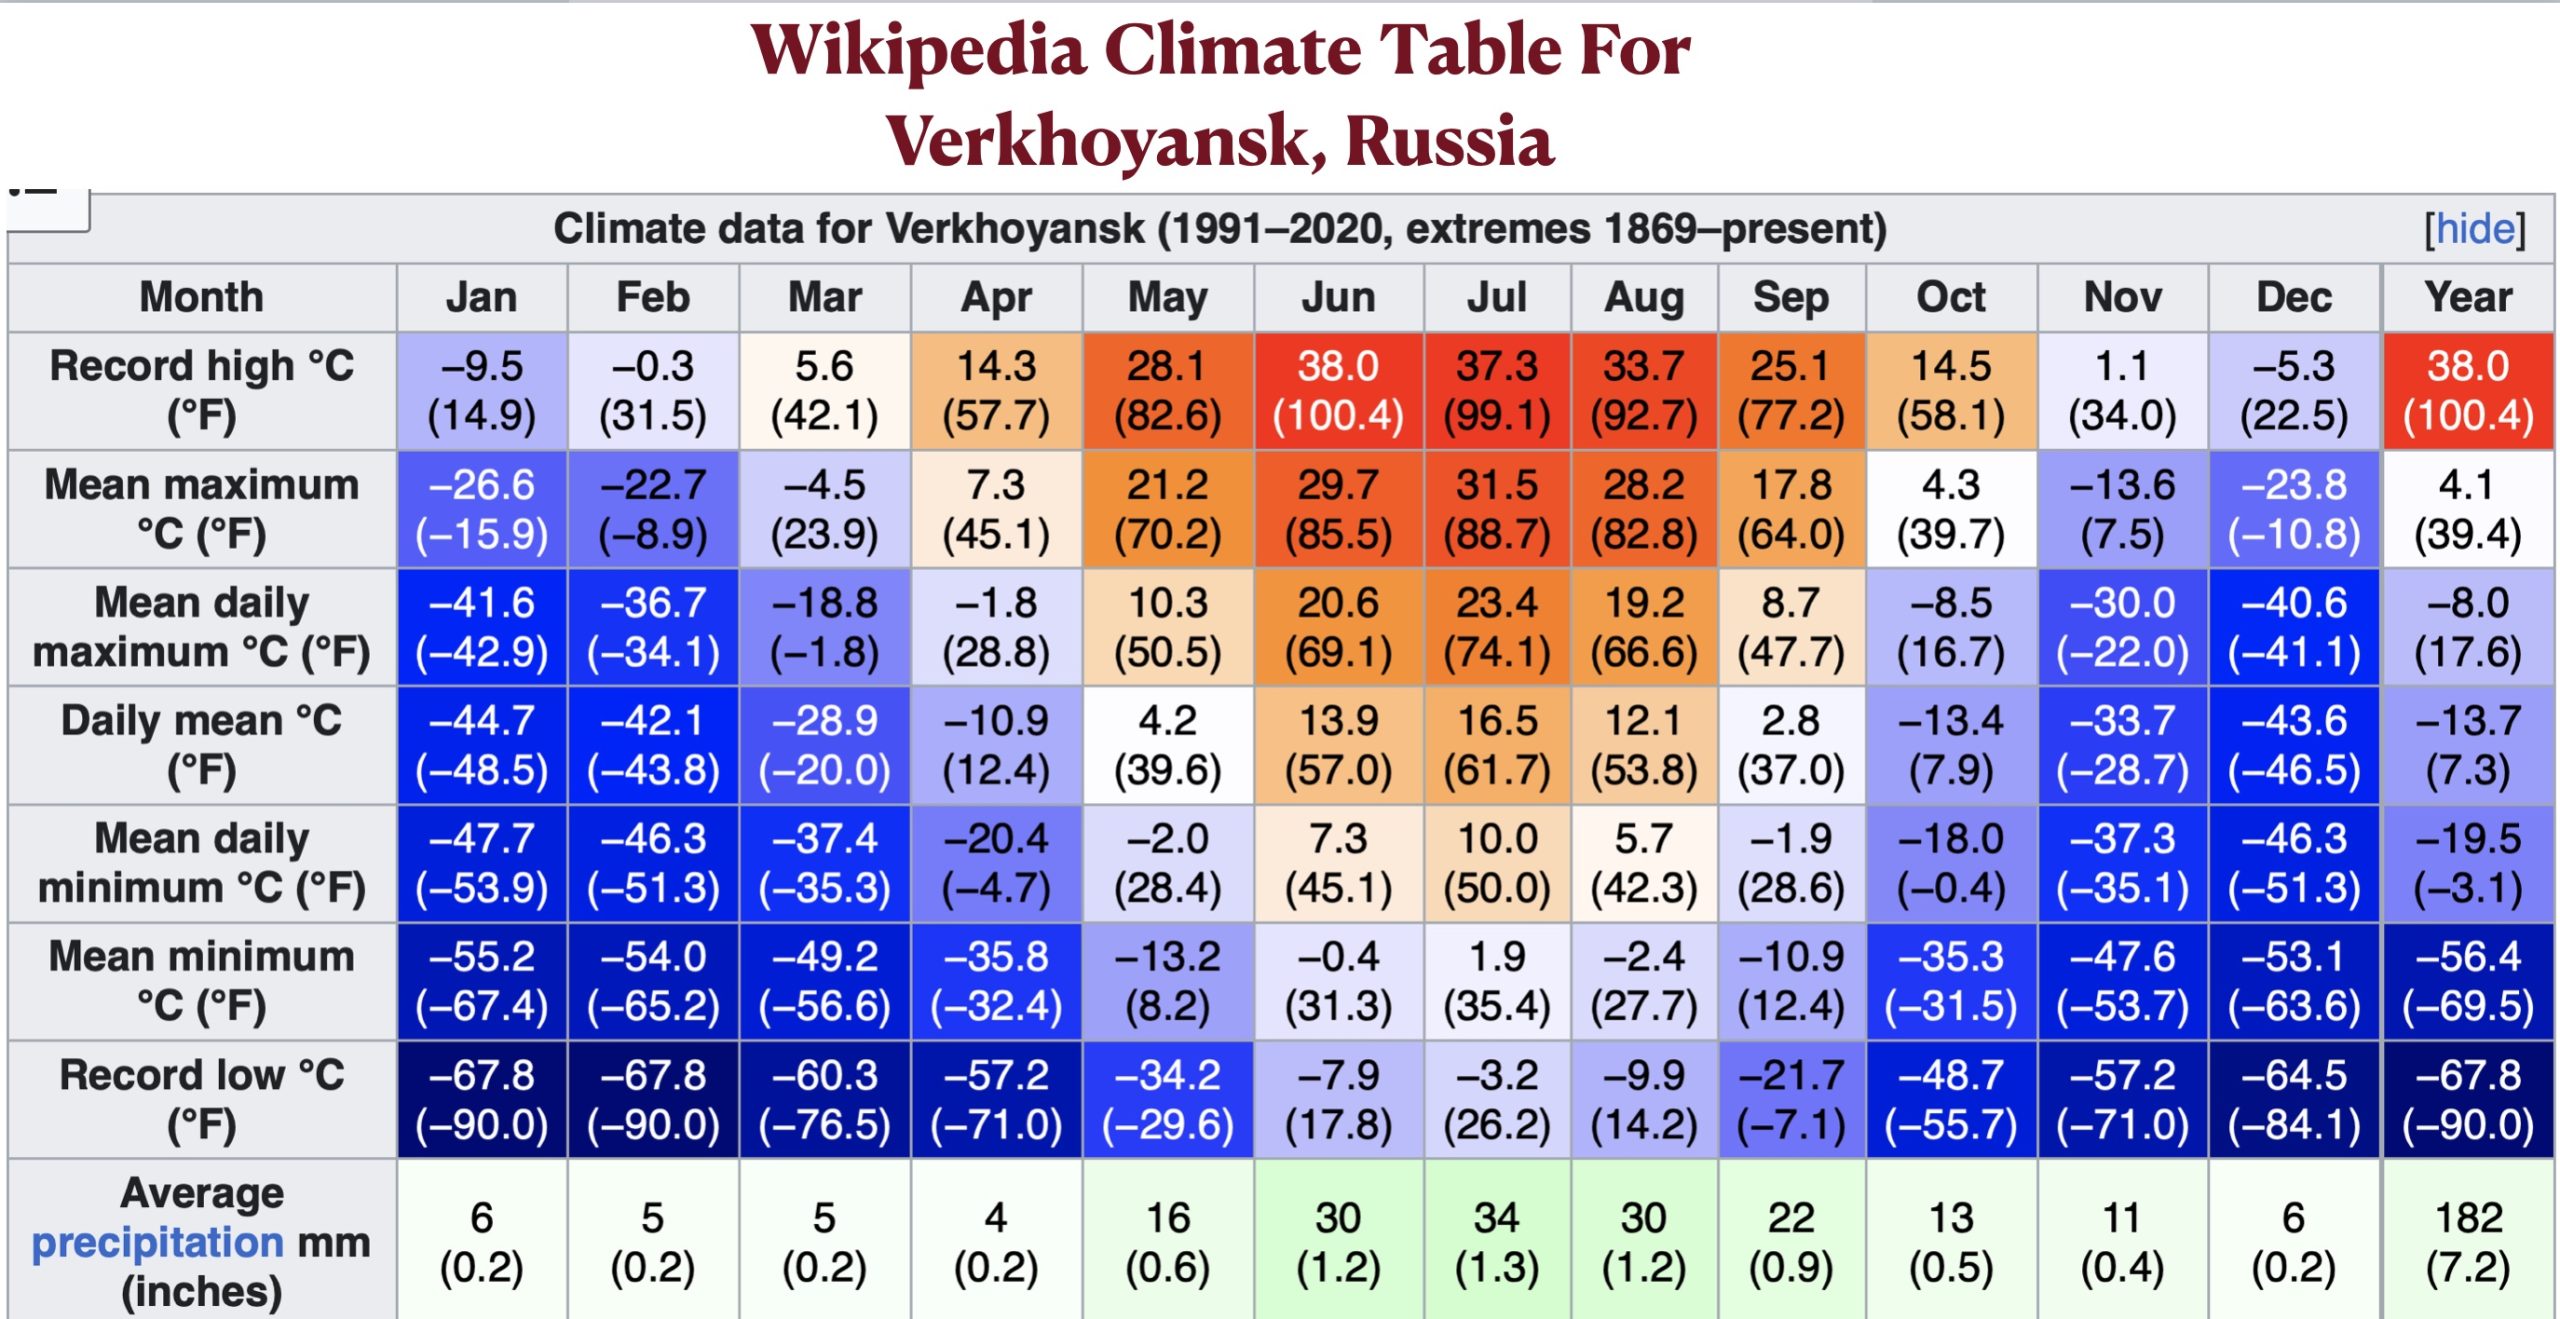
The final map is the worst, even though it differentiates the largest number of climate zones. It extends the temperate zone into absurdly high latitudes, including southern Greenland, central Alaska, and north-central Siberia. Even infamously frigid Verkhoyansk, Russia, with a record low of -90°F/-67.8°C and an annual daily mean of 7.3°F/-13.7°C, is mapped in the temperate category! Equally ludicrous is the placement of southern Alberta and the Altay Mountains of Central Asia in the subtropical zone and the placement of the Tibetan and Loess plateaus of China in the ostensibly warmer “subequatorial” zone. This map is nothing less than a climatological travesty.
Although it is perhaps unfair to ridicule such maps, I do think that their prominence in internet image searches is both telling and tragic. Geographical knowledge has reached such a low state that even people tasked with producing and reviewing basic educational maps are unable to get fundamental facts right. We deserve better.
[1] Only one Aleutian island, Unimak, is actually depicted.
[2] The average annual precipitation in Chicalayo, Peru is 1.06 inches/26 mm.
[3] At 23°42’37” N latitude, Dhaka is just north of the Tropic of Cancer and thus just outside tropical zone strictly defined, but its climate is essentially tropical.